The idea is to use each player's Corsi rate in each type of start - the first shift after an offensive-zone faceoff, time after offensive-zone faceoffs but where a change has been made, time after neutral-zone faceoffs, time after defensive-zone faceoffs following a change and the first shift following a defensive-zone faceoff. Take those rates, assume the player has average ice time and you get an idea what that player's Corsi would be with even starts. To see how it works in practice, let's use the player that made me rethink things, Dan Carcillo.
Here are Carcillo's numbers in each zone:
| Dan Carcillo | Corsi / 60 |
| Ozone - faceoff shift | 67.071 |
| Ozone - after change | -0.777 |
| Neutral Zone | -15.666 |
| Dzone - after change | -13.988 |
| Dzone - faceoff shift | -64.128 |
Here is the average percentage of minutes in each type of start:
| Ozone - faceoff | 11.4% |
| Ozone - change | 19.3% |
| Neutral | 38.7% |
| Dzone - change | 19.3% |
| Dzone - faceoff | 11.4% |
Averaging using those percentages as weights, gives us -8.574. In other words, if Carcillo got the results he did in each type of start and faced average time his ES Corsi rate would be -8.574. That seems pretty reasonable, the fancy thing I came up with last time put him at -9.956 and his even-strength Corsi rate was -11.441 with a 5-on-5 ozone% of 40.6 according to BTN.
The part that concerned me is that Carcillo's Corsi rate the first shift in the offensive zone was 67.071. He played 38 such minutes, which is a small sample and puts him 595th in such time but he did play 57 games last year. Someone playing a decent number of games and getting 40% ozone starts is just the kind of player we'd likely be the most interested in finding adjustments for. Among players with his ozone faceoff shift time or more, Carcillo had the 12th highest Corsi in the league the first shift after an offensive-zone faceoff. This fails the eye test and his ice time is an indication - he was only 21st on the Flyers at PP time.
This raises a theoretical problem with the metric - we are taking the average of five averages, some of which have very small sample sizes. Eric T from BSH suggested lumping in all the situations which are more-or-less neutral - neutral-zone faceoffs and time after faceoffs at either end after a change has been made. That's a great suggestion, which I'll look into later, but time the first shift after a faceoff at either end is the most problematic so it won't help. For Carcillo, it's very clear that his numbers are skewed for that first average. In contrast to the idea I proposed last week, the methodology of averaging averages will lead to bigger problems with small samples. It's not surprising that Carcillo's numbers in the rejected metric are better than the version that made the cut.
What's the Difference?
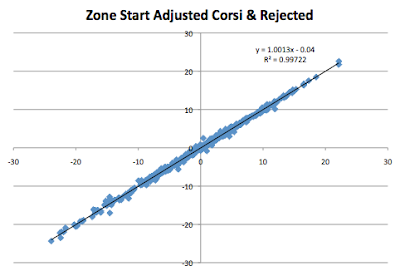
While I didn't know this at the time I published my article last week, I was quite happy to see that there is very little difference between the two ways of adjusting for zone starts for players that have played a decent amount. Here is a graph with the Zone Start Adjusted Corsi using the methodology I put forward about a week ago and the rejected idea I've discussed in this article for all players with at least 300 minutes of even-strength ice time last year. Needless to say, they are extremely similar.

Given how little difference there is in results, I think the better method to use is the one in the previous article - subtract off what the league average Corsi player would get with the player's ice time. It should do better with the smaller samples common in one season.
Here is a link to a google spreadsheet with ZSAC and ZSAC2, which is the methodology discussed here. I've also included the Corsi rate for each player following offensive-zone starts, defensive-zone starts and in neutral situations.
I think this will understate the value of all players with relative strengths who are used disproportionately in those situations in which they are strongest.
ReplyDeleteGreat point, anonymous!
ReplyDeleteUsing the rejected approach from this article, apart from increasing or decreasing variance it wouldn't matter how much time the player spent in each situation. In reality, a guy better at a certain aspect of the game being used well by the coach would provide value from that extra time. This would show up in the ZSAC metric I outlined in the previous article, so that's another reason it is superior to the rejected one.