Showing posts with label Zone Start. Show all posts

Monday, October 24, 2011

Zone Start Adjustments: A Rejected Idea

We got a lot of feedback from my recent article going over a method for adjusting for zone starts. Among the suggestions was actually my initial idea which I later rejected - look at the player's Corsi rate in each situation and weight them using average ice time in each situation. I rejected this idea in favor of the reverse - use the player's ice time and the league average Corsi rate in each situation to determine what the average player would get with the player's ice time and subtract that. In this article, I will discuss my initial idea, why I rejected it and how the results differ. The good news is that both methodologies yield quite similar results.

The idea is to use each player's Corsi rate in each type of start - the first shift after an offensive-zone faceoff, time after offensive-zone faceoffs but where a change has been made, time after neutral-zone faceoffs, time after defensive-zone faceoffs following a change and the first shift following a defensive-zone faceoff. Take those rates, assume the player has average ice time and you get an idea what that player's Corsi would be with even starts. To see how it works in practice, let's use the player that made me rethink things, Dan Carcillo.

Here are Carcillo's numbers in each zone:

Dan CarcilloCorsi / 60
Ozone - faceoff shift67.071
Ozone - after change-0.777
Neutral Zone-15.666
Dzone - after change-13.988
Dzone - faceoff shift-64.128

Here is the average percentage of minutes in each type of start:

Ozone - faceoff11.4%
Ozone - change19.3%
Neutral38.7%
Dzone - change19.3%
Dzone - faceoff11.4%

Averaging using those percentages as weights, gives us -8.574. In other words, if Carcillo got the results he did in each type of start and faced average time his ES Corsi rate would be -8.574. That seems pretty reasonable, the fancy thing I came up with last time put him at -9.956 and his even-strength Corsi rate was -11.441 with a 5-on-5 ozone% of 40.6 according to BTN.

The part that concerned me is that Carcillo's Corsi rate the first shift in the offensive zone was 67.071. He played 38 such minutes, which is a small sample and puts him 595th in such time but he did play 57 games last year. Someone playing a decent number of games and getting 40% ozone starts is just the kind of player we'd likely be the most interested in finding adjustments for. Among players with his ozone faceoff shift time or more, Carcillo had the 12th highest Corsi in the league the first shift after an offensive-zone faceoff. This fails the eye test and his ice time is an indication - he was only 21st on the Flyers at PP time.

This raises a theoretical problem with the metric - we are taking the average of five averages, some of which have very small sample sizes. Eric T from BSH suggested lumping in all the situations which are more-or-less neutral - neutral-zone faceoffs and time after faceoffs at either end after a change has been made. That's a great suggestion, which I'll look into later, but time the first shift after a faceoff at either end is the most problematic so it won't help. For Carcillo, it's very clear that his numbers are skewed for that first average. In contrast to the idea I proposed last week, the methodology of averaging averages will lead to bigger problems with small samples. It's not surprising that Carcillo's numbers in the rejected metric are better than the version that made the cut.

What's the Difference?


While I didn't know this at the time I published my article last week, I was quite happy to see that there is very little difference between the two ways of adjusting for zone starts for players that have played a decent amount. Here is a graph with the Zone Start Adjusted Corsi using the methodology I put forward about a week ago and the rejected idea I've discussed in this article for all players with at least 300 minutes of even-strength ice time last year. Needless to say, they are extremely similar.
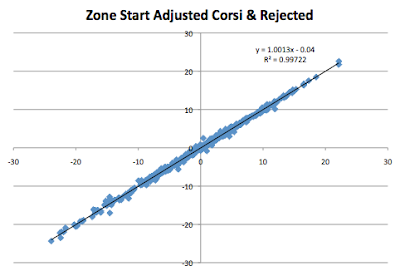

Given how little difference there is in results, I think the better method to use is the one in the previous article - subtract off what the league average Corsi player would get with the player's ice time. It should do better with the smaller samples common in one season.

Here is a link to a google spreadsheet with ZSAC and ZSAC2, which is the methodology discussed here. I've also included the Corsi rate for each player following offensive-zone starts, defensive-zone starts and in neutral situations.

Friday, October 14, 2011

Adjusting for Zone Starts: Zone Start Adjusted Corsi

In a previous article I discussed zone starts and introduced a new approach to analyzing the effect of zone starts - breaking up performance by each type of ice time: offensive zone the first shift after the faceoff, offensive zone faceoff after a change, after a neutral-zone start, defensive-zone start after an on-the-fly change and the first shift after a defensive-zone faceoff. In this article, I will introduce a metric that adjusts for zone starts and a simplified metric that provides a good rule-of-thumb for you to use when looking at BTN.

Zone Start Adjusted Corsi

The idea is simple: take a player's ice time and use the league average Corsi for each type of start to determine what an average player's Corsi would be with the same ice time. Subtracting that off will give you how much he is above, or below, what the average player would get with his ice time. To see how this works, let's look at the poster child for zone-start adjustment, Manny Malhotra. Here is a chart summarizing Malhotra's time in each start, along with his Corsi numbers:

Manny MalhotraTime (mins)Corsi / 60
Ozone, first shift55.248.913
Ozone, after change170.8-7.376
Neutral Zone340.3-6.524
Dzone, after change142.3-13.073
Dzone, first shift178.7-31.234
All Time887.2-9.265

Here are the league averages for each type of ice time:

League AverageCorsi / 60
Ozone, first shift40.147
Ozone, after change2.818
Neutral Zone0
Dzone, after change-2.818
Dzone, first shift-40.147

Weighting by Malhotra's ice time gives us -5.496, meaning that if someone performing at the league-average level was given Mr. Malhotra's ice time he would have a Corsi of -5.496. To get Manny's Zone Start Adjusted Corsi we subtract that off, in other words add 5.496, to get -3.769.

A Rule of Thumb: Simplified Zone Start Adjusted Corsi

That's all well and good, but it would be nice to have something a little more portable. Even with all the data, I'd like to be able to just pull up BTN and get an idea how to adjust for a guy's Ozone%. To get something simpler, I recorded the Ozone% according to BTN for all of the players with at least 600 minutes of even-strength-goalies-on ice time and ran a regression to get the average adjustment for a given ozone%. Here is a scatter plot of the 508 players. The numbers on the x-axis represent how far off from 50% Ozone%, the y-axis is the size of the adjustment or the negative of what the average player would get with the same ice time:


As you can see, a simplified formula will come very close to the more complicated version above which forces us to look at the individual data. Any differences are based on how much time a player spends in the relatively neutral situations where he is jumping on the ice after a faceoff at either end. The result of this is a simple formula. To adjust for zone starts, multiply how many percentage points the player's Ozone% is from 50% by 0.18 and add or subtract accordingly. In formula, with Ozone% out of 100:

Simplified Zone Start Adjusted Corsi = Corsi/60 - (Ozone% - 50)*0.18

Another way to think about it is to add or subtract 1.8 for every 10 percentage points. So if you gave a guy with even zone starts 60% Ozone starts then we'd expect his Corsi rate to go up 1.8. If you put him in more defensive spots with just a 30% Ozone% then his Corsi will drop about 3.6.

Results:

I don't want to clutter it with a 900-row table, so I'll make a table with the top 25 and another with a few players of interest with particularly high or low Ozone%. Here is a google spreadsheet with all the Zone Start Adjusted Corsi stats from 2010-2011.

RankPlayerTeamPosZone Start Adjusted CorsiCorsiTime On Ice
1Kyle WellwoodSJSF22.12522.203462.1
2Torrey MitchellSJSF18.50418.336791.9
3Joe PavelskiSJSF17.30415.9391039
4Ryane CloweSJSF16.57116.7151148.7
5Alexandre PicardMTLD16.53817.308634.4
6Mason RaymondVANF16.51517.695922.3
7Ryan KeslerVANF16.50916.5881135.7
8Brian RafalskiDETD15.30516.0831033.4
9Nikolay ZherdevPHIF15.02914.418653.4
10Justin WilliamsLAKF14.84314.7171043.7
11Evgeni MalkinPITF14.77315.509607.4
12Sean BergenheimTBLF14.65213.625916
13Tim JackmanCGYF14.64516.275726.3
14Viktor StalbergCHIF14.21716.208799.6
15Pavel DatsyukDETF14.03913.3848.1
16Logan CoutureSJSF13.74314.0781133.7
17Alexander SteenSTLF13.72214.481081.5
18Jason DemersSJSD13.68513.5911169.9
19Mikael BacklundCGYF13.37614.034761
20Patrik EliasNJDF13.27513.3061082.2
21Mark LetestuPITF13.26214.613759.6
22Tomas HolmstromDETF12.9113.418840.7
23Chris HigginsVANF12.18311.156790.6
24Brian GiontaMTLF12.0812.1511185.1
25Tyler KennedyPITF11.81312.581996.8

People of interest:

PlayerTeamPosZone Start Adjusted CorsiCorsiTime On Ice
Henrik SedinVANF7.18511.8031235.3
Patrick KaneCHIF10.5213.7381139.9
Marian GaborikNYRF-7.194-4.829882.1
J-P DumontNSHF2.4764.62662.4
Ville LeinoPHIF-3.973-2.1871097.6
Manny MalhotraVANF-3.769-9.265887.2
Blair BettsPHIF-15.221-18.412501.9
Steve OttDALF-4.526-8.3461020.9
Jerred SmithsonNSHF-6.98-10.442965.3
Dave BollandCHIF-1.198-3.2806.3


Please Leave Feedback!

As this is my first effort in coming up with a new statistic, I would love some feedback on this. Does the methodology make sense? Is the Ozone% adjustment of .18 per percentage point pretty close to what you've been doing? Any and all comments appreciated.

Thursday, September 8, 2011

On Zone Starts - Team Situational Stats

Here are the team situational stats. For more information see the original article.

Ozone, faceoff shift - the most recent faceoff was in the team's offensive zone. All players that were on the ice for the faceoff remain on the ice.

RankTeamCorsi/60
1PHI54.228
2T.B51.08
3VAN49.815
4BOS48.759
5CGY48.441
6DET46.786
7BUF45.822
8L.A45.387
9NYR44.161
10S.J42.515
11WSH42.389
12COL42.381
13MTL42.069
14PHX41.97
15STL41.963
16CBJ41.268
17PIT40.983
18OTT38.66
19FLA38.103
20CHI36.331
21CAR35.763
22N.J35.138
23TOR33.567
24NSH33.555
25WPG33.431
26NYI33.14
27ANA31.991
28DAL30.702
29MIN28.032
30EDM20.284

Ozone, on-the-fly - the most recent faceoff was in the team's offensive zone. At least one player who was on the ice for that faceoff has left.

RankTeamCorsi/60
1STL13.715
2DET11.981
3CHI11.927
4S.J11.322
5VAN9.631
6N.J7.863
7WPG7.033
8BOS6.542
9T.B5.909
10PIT4.99
11BUF4.653
12CGY4.295
13PHX4.086
14L.A4.053
15CAR2.664
16OTT2.457
17MTL2.193
18FLA2.062
19NSH1.123
20WSH1.062
21TOR0.147
22CBJ-0.606
23EDM-1.617
24DAL-2.016
25COL-2.887
26PHI-3.068
27NYR-3.263
28MIN-7.285
29NYI-8.869
30ANA-12.004

Neutral Zone - the most recent faceoff took place in the neutral zone.

RankTeamCorsi/60
1DET8.91
2S.J8.122
3PIT6.662
4CGY6.402
5CHI5.329
6WSH5.32
7MTL4.566
8T.B3.503
9FLA2.949
10VAN2.817
11N.J2.453
12PHX1.373
13L.A1.234
14BUF0.774
15CBJ0.545
16BOS0.038
17STL-1.229
18WPG-1.438
19CAR-1.656
20NYR-1.69
21NSH-1.703
22PHI-3.096
23DAL-3.323
24OTT-3.735
25MIN-5.621
26EDM-5.945
27TOR-5.955
28NYI-6.438
29ANA-8.643
30COL-9.949


Dzone, on-the-fly - the most recent faceoff was in the team's defensive zone. At least one player who was on the ice for that faceoff has left.

RankTeamCorsi/60
1STL6.676
2S.J5.267
3CHI5.073
4PIT3.967
5L.A1.756
6T.B1.725
7VAN1.537
8WSH0.711
9N.J0.564
10DET0.326
11OTT-0.234
12CBJ-0.746
13NSH-1.143
14WPG-1.893
15TOR-2.502
16CGY-2.646
17PHI-3.433
18MTL-3.687
19BOS-4.026
20FLA-4.537
21PHX-4.809
22BUF-5.957
23COL-5.962
24NYR-6.533
25DAL-6.778
26CAR-6.989
27EDM-8.336
28NYI-8.625
29MIN-14.866
30ANA-17.406


Dzone, faceoff shift - the most recent faceoff was in the team's defensive zone. All players that were on the ice for the faceoff remain there.

RankTeamCorsi/60
1N.J-24.725
2CBJ-28.026
3PIT-28.448
4MTL-29.541
5S.J-29.619
6L.A-30.262
7DET-32.495
8BOS-34.246
9FLA-35.538
10PHX-35.628
11VAN-35.931
12STL-36.241
13OTT-37.688
14T.B-38.08
15CHI-39.613
16WSH-40.122
17COL-42.147
18PHI-42.258
19CAR-42.514
20BUF-42.67
21DAL-44.144
22MIN-44.151
23NSH-44.536
24NYR-46.649
25TOR-49.143
26CGY-49.905
27NYI-50.559
28EDM-51.105
29ANA-56.561
30WPG-60.533


Here is a table giving the rankings for each team in the 5 categories:

TeamO-firstO-flyNeutralD-flyD-first
ANA2730293029
BOS4816198
BUF711142220
CAR2115192619
CBJ162215122
CGY51241626
CHI2035315
COL1225302317
DAL2824232521
DET621107
EDM3023262728
FLA19189209
L.A8141356
MIN2928252922
MTL13177184
N.J2261191
NSH2419211323
NYI2629282827
NYR927202424
OTT1816241113
PHI126221718
PHX1413122110
PIT1710343
S.J104225
STL15117112
T.B298614
TOR2321271525
VAN3510711
WPG257181430
WSH11206816

On Zone Starts

How valuable are offensive-zone faceoffs? How much should we adjust the Sedins' stats to take into account that they take three faceoffs in the offensive zone for every one at the other end? Are coaches using their guys effectively, or should they almost turn them into specialists like Vigneault does in Vancouver? Is it better for a coach to focus on zone starts, matchups or just roll lines to keep his guys fresh and the best playing the most?

These are just a few of the many, many questions that relate to zone starts that come up in hockey analysis. We'll put off dealing with most of those until later, this article will be more of a broad discussion and introduction to what I feel is a novel approach that we'll be using a lot.

The Data

I'm going to start with team stats. This is pretty strange because zone starts aren't a team issue. A team that has more offensive-zone starts than defensive has earned them; good zone starts aren't just handed down to the team by some suit. In contrast, a player only reaps what he sows, as it were, if he or a teammate ices the puck or possibly after a very short shift. Most faceoffs are taken with fresh players that were on the bench when the stoppage occurred. Despite that, using team stats is a good place to start because we can get a pretty good idea how the location of the most recent faceoff affects results.

The data come from a common source: NHL play-by-play and roster reports. In this case, I am using every game available for the 2010-2011 regular season. As usual, it's even strength with both goalies on the ice. Using the roster reports, which say when each player was on the ice during the game, I isolated these 5 situations:

Ozone, first shift - the most recent faceoff was in the team's offensive zone. All players that were on the ice for the faceoff remain on the ice.

Ozone, on-the-fly - the most recent faceoff was in the team's offensive zone. At least one player who was on the ice for that faceoff has left.

Neutral Zone - the most recent faceoff took place in the neutral zone.

Dzone, on-the-fly - the most recent faceoff was in the team's defensive zone. At least one player who was on the ice for that faceoff has left.

Dzone, first shift - the most recent faceoff was in the team's defensive zone. All players that were on the ice for the faceoff remain there.

To clarify, once any of the original faceoff guys have left the ice the rest of the time before the next stoppage is in the on-the-fly category. So the faceoff shift is only that first shift, even if later it so happens that the 10 skaters that were on the ice are out there together.

Note: I have separated out the team results to keep this post about the general concepts. If you want to see how good your team is in each situation, you can find that here.

Ice Time and Goals

Let's take a look at how much time was spent and how many goals were scored on average in each situation. This will give us a very rough idea how important faceoffs are in the offensive or defensive zone.

SituationIce Time%Goals%
Ozone, first shift452.511.4%21.213.8%
Ozone, on-the-fly765.119.3%32.321.0%
Neutral1538.938.7%5435.1%
Dzone, on-the-fly765.119.3%34.822.7%
Dzone, first shift452.511.4%11.47.4%
Total3974.1100%153.6100%

The first thing I noticed is that the first shift only accounts for about 37% of the ice time following a faceoff at either end. Part of that is that I'm being very strict defining the first shift; it would increase if I allowed for one guy to leave the ice, for example. In any case, you might wonder why we focus so much on who is on the ice for a faceoff when so much of a player's ice time after an ozone/dzone faceoff started with him jumping onto the ice.

The goals columns give you a pretty strong hint. Look at the second and fourth rows. Following a faceoff outside the neutral zone, once a change was made more goals were scored by the team that took the faceoff in their defensive zone! We'll later see that this is likely just due to random chance, but it seems clear that if you come on in an on-the-fly change it's more like a neutral-zone start than being on for a faceoff at either end.

Corsi

Let's look at the average team Corsi rate for each situation. I use the average team rate for each situation so we don't have the endogeneity effect I wrote poorly about a couple months ago. In other words, if we simply averaged out all the ice time we'd overestimate how important it is to be in the offensive zone because good teams tend to get more faceoffs in the offensive zone than bad teams so we'd be lumping in team quality with ozone-faceoff value.

SituationCorsi/60
Ozone, first shift39.957
Ozone, on-the-fly2.603
Neutral0.019
Dzone, on-the-fly-2.784
Dzone, first shift-40.103

Here you can see how much having a faceoff in the good zone helps your team out territorially. I'm sure that there is an effect didn't surprise you, but suspect how large it is might have. It's also interesting to note that this almost completely goes away once the first change happens. This shouldn't be a surprise either, teams don't change without the puck leaving the zone, but one might have expected more of a ripple effect. The most common way to change lines is to dump the puck and give the other team possession, albeit starting behind their own net. It does not appear that being able to breakout the Flying V gives you much of an edge.

This is a nice segue back to why we should care so much more about who is actually on for the faceoff and not just ice time afterward. Let's exaggerate and suppose that Henrik Sedin and Manny Malhotra spend the same amount of post-offensive-zone-faceoff time on the ice but Hank's is all first-shift time while Manny doesn't take a single offensive-zone faceoff. Sedin's ozone time will be extremely favorable, and Malhotra's only slightly so. In this extreme scenario we would need to adjust Sedin's stats a lot to take his type of ice time accurately into account. Being out there on the faceoff in front of their goalie is over 15 times as favorable as jumping on the ice after.

Conclusion: More To Come

When I thought of this method of separating out the ice time, I did a little fist pump. While I don't think this, or really any metric, will blow everything else away it seems like a good way to analyze zone starts and give us better insight into player value and coaching decisions. We will be using this and related methods a lot in the future, especially the coming weeks leading up to the season. Coming down the pipe is a new player metric to adjust for zone starts. We'll also do in-depth analysis on zone starts for the two teams that focus the most on them: the recently rivalrous Vancouver Canucks and Chicago Blackhawks. Are Vigneault and Quenneville outsmarting the rest of the league or is it a case of fancy coaching syndrome? If you ask nicely, we could probably do something similar for your favorite team, or even your favourite team.

Here is a link to the team data.

Wednesday, June 29, 2011

Putting Skaters in a Context: The World of Advanced Hockey Metrics

With the world of advanced hockey metrics continually improving, we are now beginning to see hockey players evaluated in more diverse ways than ever before. Since the beginning of many a hockey fandom, a quick glance at a skater’s goals, assists and total points has been the measure that grades offensive prowess across the league’s scorers. Now, however, the emergence of a few newer (and quite frankly, better) statistics allows us to take these age-old points totals and put them in a context, showing just how valuable a player may or may not be to his team’s success. Here at Driving Play, while attempting to evaluate different players across the league we will be commonly referring to many of these newer statistics within our analysis. Below is a quick list that will attempt to make clear just what we may be referring to if an unfamiliar term happens to appear within one or more of our posts.

A Corsi Number – Similar to a +/- statistic, Corsi gives a player a (+) upon the event of his team generating either a shot on goal, a missed shot, or a blocked shot directed at the opponent’s net while he is on the ice. Similarly, a player earns a (-) if the opponent generates a shot on goal, missed shot, or a blocked shot directed at his own net. Sometimes this can be expressed as a percentage, i.e. the percentage of the total shots that are directed at the opponent’s net while a player is on the ice. Corsi can also be expressed in a “Relative Corsi” number which is the difference between a player’s on-ice Corsi score and the shot differential while he is on the bench. Relative Corsi is generally used to look at which players are having the most positive effects on shot totals relative to their teammates.

A Fenwick Number – Since many consider shot-blocking a measurable skill in the hockey world, a Fenwick number is the same as a Corsi number, except blocked shots are taken out of the equation. So, a player will earn a (+) if his team generates a shot on goal or a missed shot whilst he is on the ice, and a (-) if either event occurs for the opponent.

Quality of Competition (QUALCOMP) – The fact is, all ice time in the NHL is not created equal. Having to line-up toe-to-toe with Sidney Crosby is a much different task than Jesse Winchester, the hockey player or the musician. QUALCOMP more or less weighs the on-ice +/- (the familiar statistic measured in goals) of a player’s opponents relative to the rest of his teammates, and averages this rating across every player faced during the season. The higher the resulting rating, the better the competition a player is facing and vice versa. There is also a CorsiRelQUALCOMP number which does the same thing, except uses Relative Corsi instead of +/-.

Quality of Teammates (QUALTEAM) – Similar to QUALCOMP, QUALTEAM weighs a player’s teammates using the exact same formula as QUALCOMP. Just like QUALCOMP, a player’s QUALTEAM rating will be higher if he is playing with first-line teammates and vice versa if he is playing with fourth-line enforcers. Also similarly, CorsiRelQUALTEAM will measure a player’s teammates using Relative Corsi.

Zone Start Percentage – A zone start percentage measures the percent of the time any player starts his shift in the offensive zone. As you might expect, players with a high defensive prowess are often called upon to start in the defensive zone frequently, and vice versa is true for those players who are more inept in their own end. This particular statistic is important in that it can directly affect a player’s aforementioned Corsi or Fenwick percentage since players who are starting in the offensive zone more frequently will have an easier time generating more shots towards the opponent’s net. What’s more, players who are more immediately deployed in defensive roles will have a harder time finding shot opportunities than their counterparts who are already starting in prime offensive positions. 

Score Effects – Within the ebbs and flows of a hockey game, it has been a long-believed ideal that teams will go into more of a “defensive mode” while ahead and try and get just about every shot possible on net while behind. Using Corsi and Fenwick percentages, it has been shown that teams who enjoy an advantage in the score are commonly outshot at improving rates as the game progresses and vice versa. With the score tied, the disparity in shot totals is most close to even which is why many advanced hockey statisticians choose to look at Corsi/Fenwick with the score tied at even strength to put players’ ice time on a level playing field.

Coming back to the original point regarding putting different skaters in a context, we are now able to more closely examine the situations that different players are playing in. For this reason, it is now much easier to come to a conclusion about their value to their respective teams. Before these statistics came into play, we could look at two players, Patrice Bergeron and Ville Leino for example, who had similar point totals during the regular season (57 and 53 respectively). In a vacuum, it may seem as if they are both comparable players toward Boston and Philadelphia’s total success. However, a little scratching beneath the surface reveals that Bergeron played against much tougher competition than Leino, and Leino enjoyed the luxury of skating with better teammates. Leino started in the offensive zone a walloping 62.3% of the time compared to Bergeron’s 42.7%, showing us that Leino was given far more prime scoring opportunities to begin his shifts which undoubtedly had a positive effect. Finally, Bergeron’s Corsi and Fenwick percentages with the score tied at even strength were 52.7 and 52.8% respectively, compared to Leino’s 54.9 and 53.1%. While a higher percentage of the on-ice shots were directed at the opponent’s net while Leino was on the ice, we have of course already noted that Bergeron faced tougher opponents and played with worse teammates than Leino which gave Leino an advantage in putting up better numbers in these categories. Had Leino, a notoriously subpar defensive forward (see: 2 seconds of average shorthanded time-on-ice/game in ’10-11) been given minutes similar to Bergeron’s, the point totals most certainly would not have looked anything similar. Considering the minutes they were given, Bergeron most certainly had an excellent season while Leino performed at a level around what we might expect from a forward given “softer” minutes during each game.